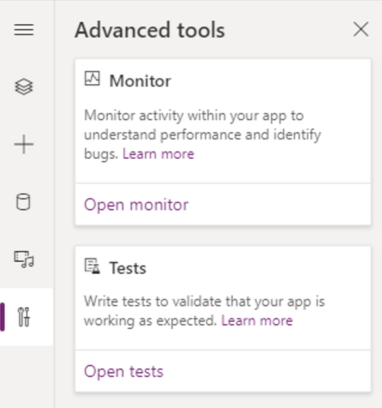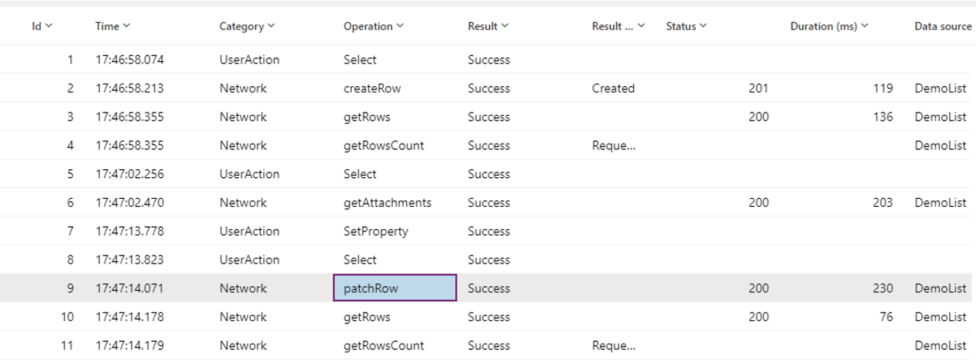
This monitor gives us a lot of information about functions being called and controls being triggered. However, this does not always contain the exact data we want, or it might be a hard job to find it. Let’s say you just save a simple SharePoint list item by clicking a button and using a Submit() function.
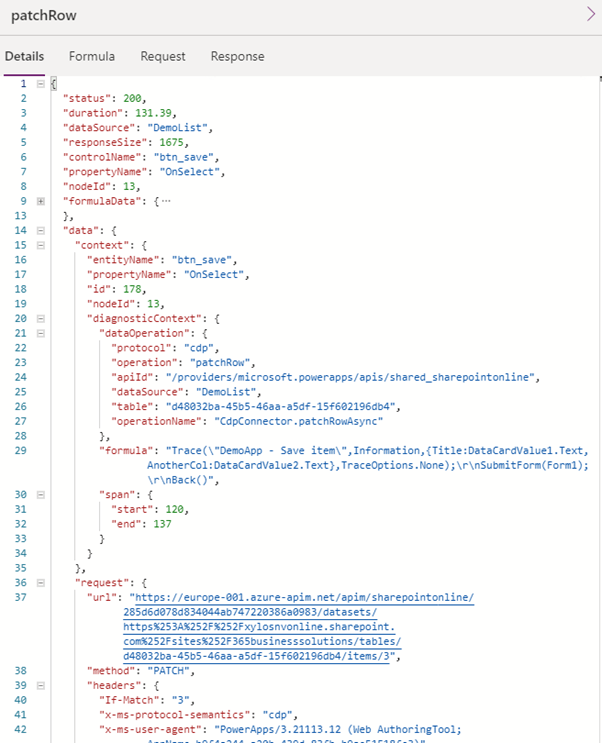
First you need to know the submit is calling the Patch() function (you should know that), but if you have a lot of things going on in your app, it might be difficult to find the step you are looking for.

The data provided is quite complex, and also there it is not that easy to find what you are looking for.

The Trace() function to the rescue
Luckily enough, we have the trace() function. This function allows us to add custom logging to the monitor.
Trace(message, trace_severity, custom_record )
- Message: this is a short description you want to log (the monitor will show this in the “result info” column.
- Trace_severity: Error, Warning, Information, but also all results from the ErrorKind enumeration)
- Custom_record: you can create your own (json) record containing all data you want to pass to the monitor
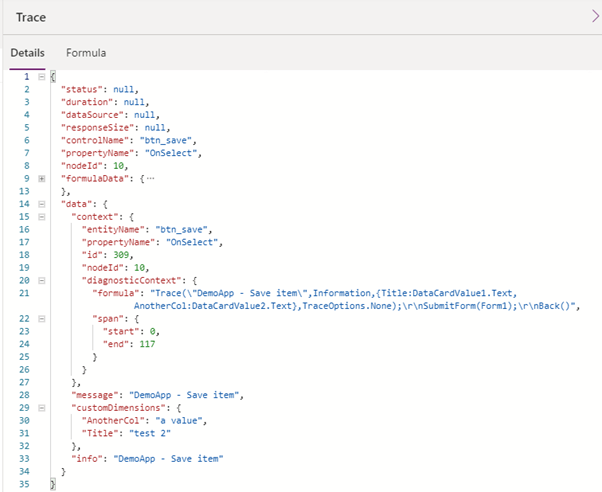
Now you can call the trace just before you submit the form. The will create an information log entry, stating you are saving an item in your DemoApp and displaying the columns with their values.
Trace(“DemoApp – Save item”,Information,{Title:TitleDataCardValue.Text,AnotherCol:ColDataCardValue.Text});
The result would be this:


You can add a trace in all places where you can other other formulas. This will allow you to have a much faster an clearer view on what is happening in your app.
Tip: You want to check if a patch was done successfully? Just add the following after patching:
If(!IsEmpty(Errors(dataSource)),trace(“Demo App – Error while saving”,Error,…))
Linking your Power App with Application Insights on Azure
Did you know that you can link your app with Application Insights on Azure? You just need to copy the Instrumentation key from the insights into your Power App (on the App object).
After that, you can check the Logs of the Application Insights to see your traces (note: you need to query the “traces” table.

Using the Application Insights now allows you to check the traces whenever a user reports an issue with your app, instead of asking him or her to reproduce the problem while looking at the monitor.